Data visualization design
Strengthening executive decision making at a health system through data visualization
Using data to make more informed decisions at a large U.S. health system
Role: UX design
Timeline: Four months
Using data to make more informed decisions at a large U.S. health system
Role: UX design
Timeline: Four months
Business problem
Executives don't have a standardized way of measuring performance at their Monthly Operating Reviews (MORs). They use different metrics and there isn't a single source of truth for each metric.
Outcome
Designed a balanced scorecard to help executives establish a common practice. In the first five months since its launch, the scorecard was used more than 13,000 times by more than 1,000 users, and marked a significant improvement from legacy dashboards.
In 2014, the healthcare world was introduced to a new idea: the Quadruple Aim framework.
The framework suggested that health systems (i.e., hospital chains) focus on four goals:
In 2024, Providence Health decided to adopt this at a system-level. There was a sense of urgency because the COVID-19 pandemic had challenged the organization’s finances. To improve the health system’s...health, leaders needed a common framework for performance management.
Executives had the following pain points:

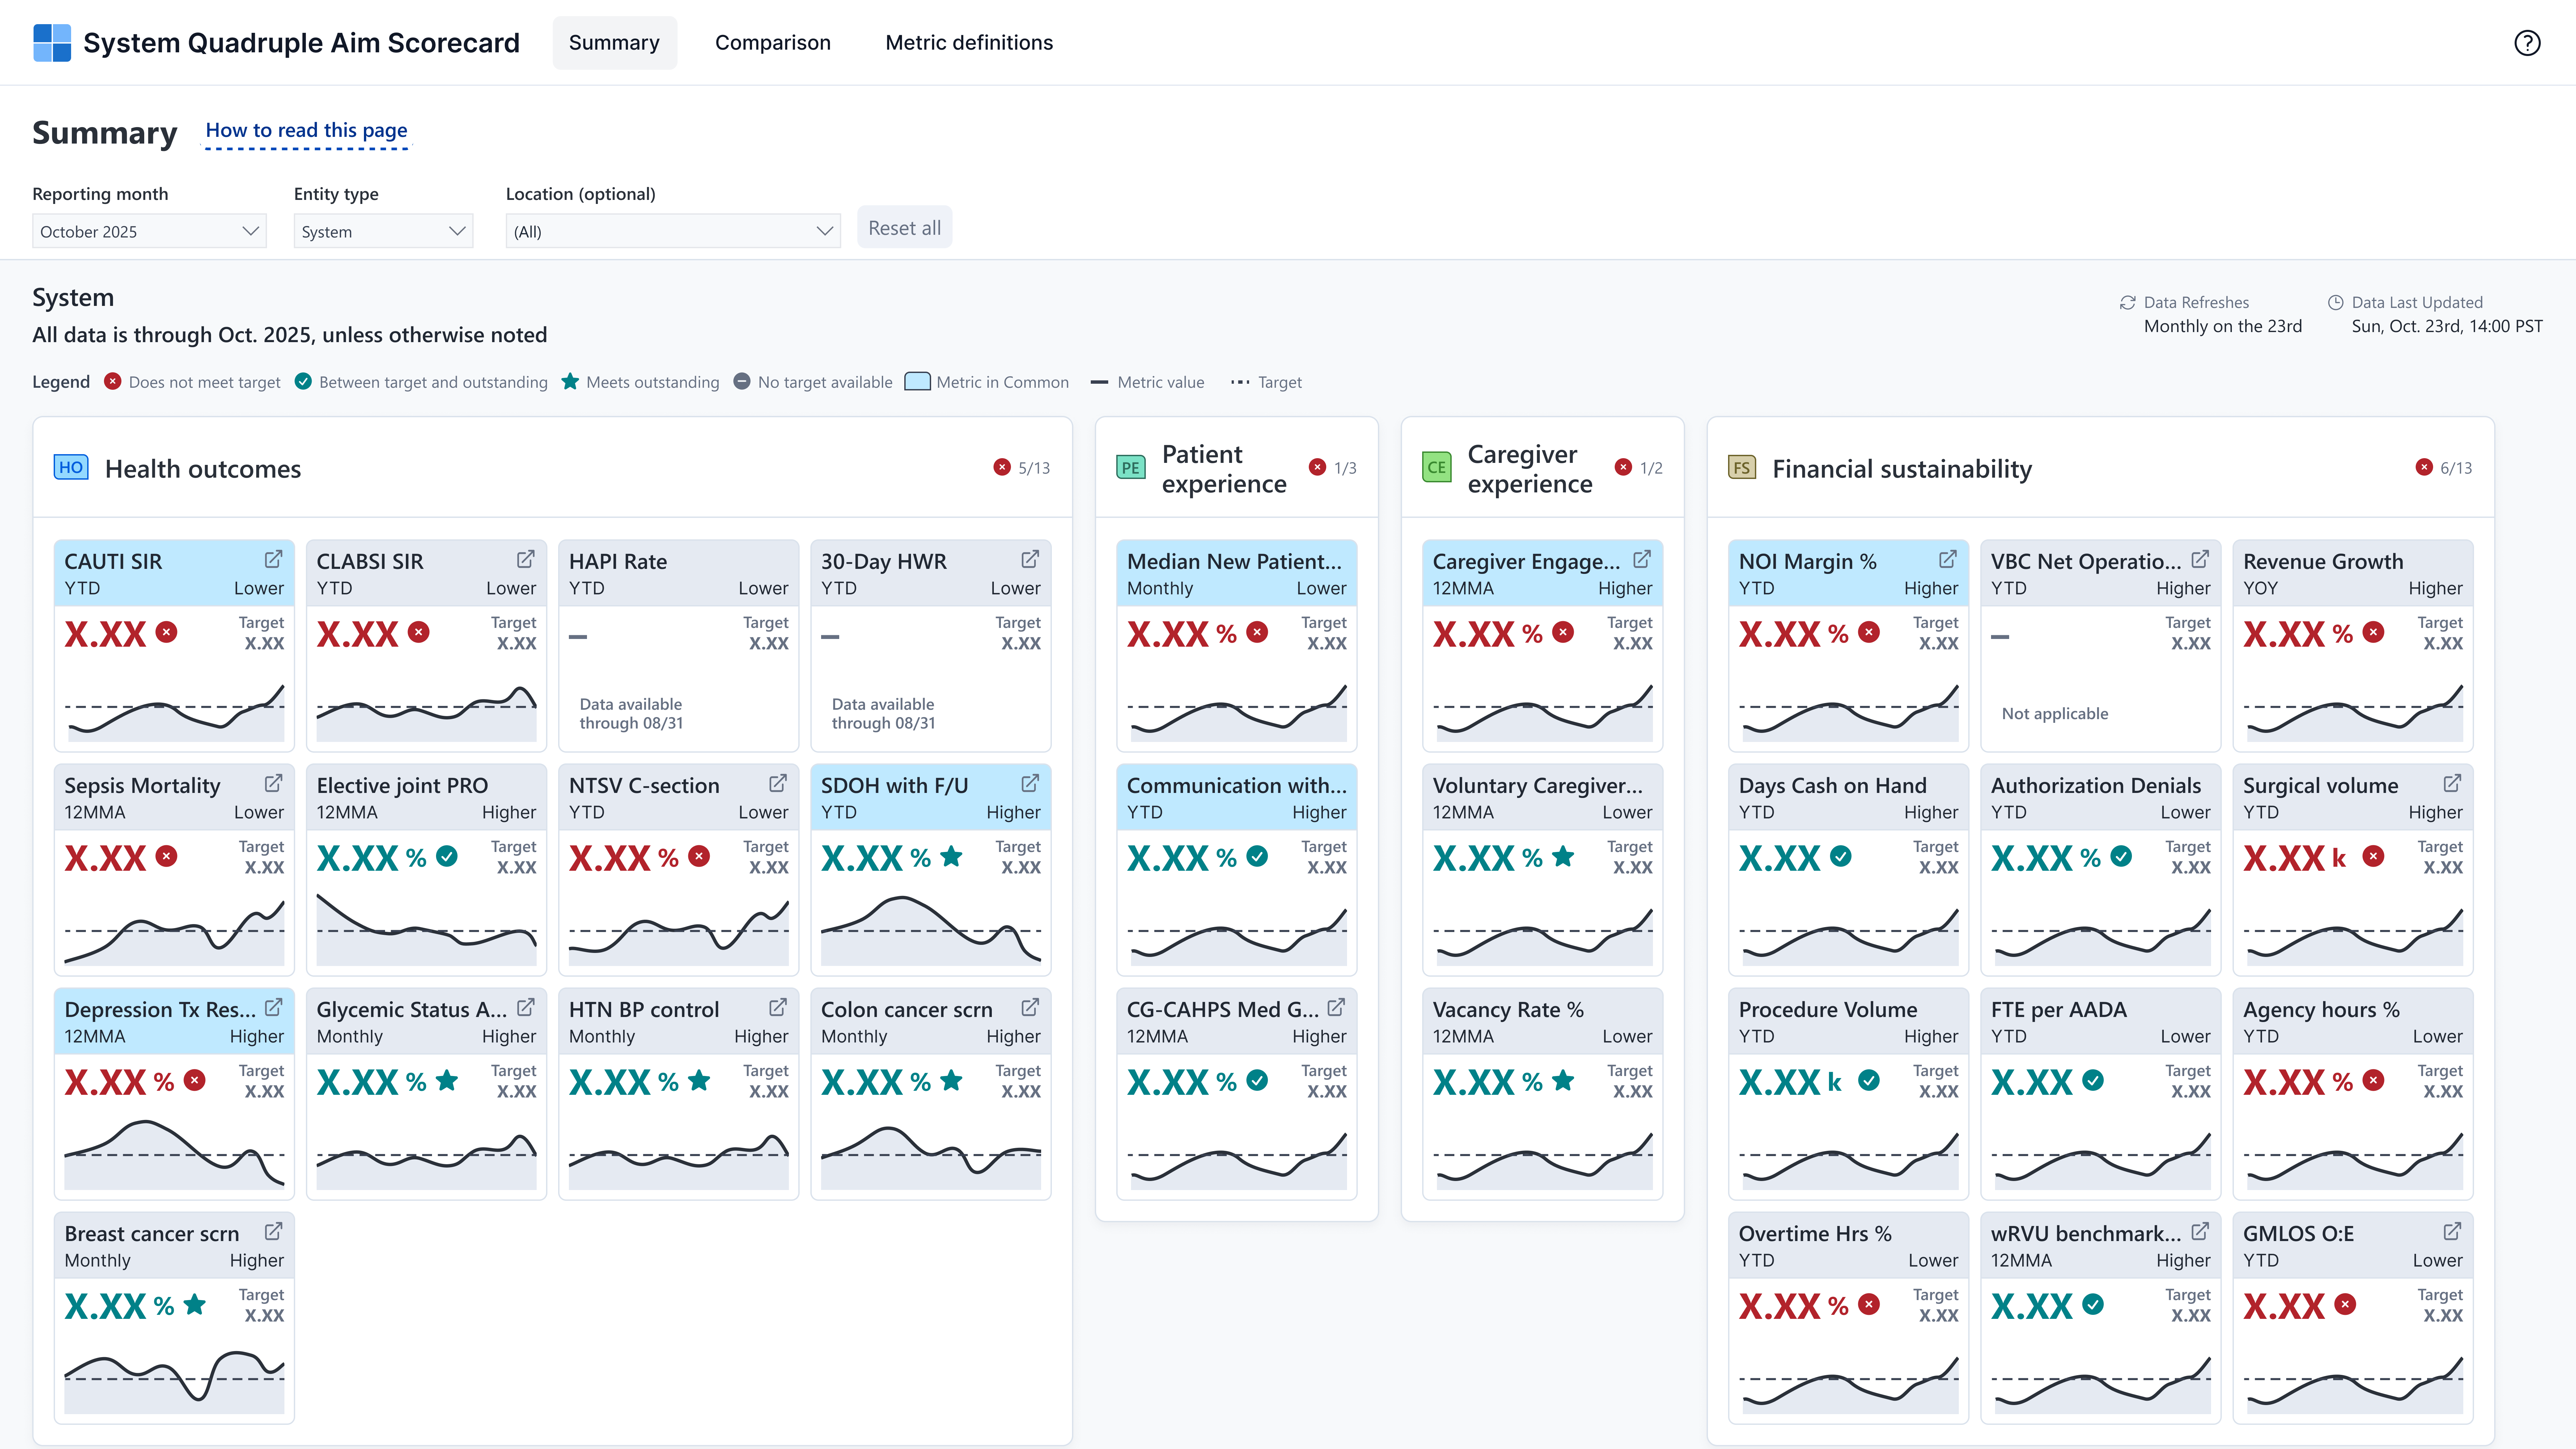
System-level executives wanted one balanced scorecard to present these metrics and whether or not they were meeting monthly targets. This report would be used at Monthly Operating Reviews (MORs) to see what areas to focus on in the following month.
A team of user researchers performed a competitive analysis for three legacy dashboards that executives used at the time. These three reports were to be sunset and consolidated into one new report called System Quad Aim.
I created and disseminated a baseline survey to collect feedback on the legacy dashboards. Through this, we quantified users’ perceptions on the legacy dashboards around metric refresh rates, navigability, ease-of-use, and more. After analyzing responses, we learned most users felt it was difficult to understand what metrics they were looking at.
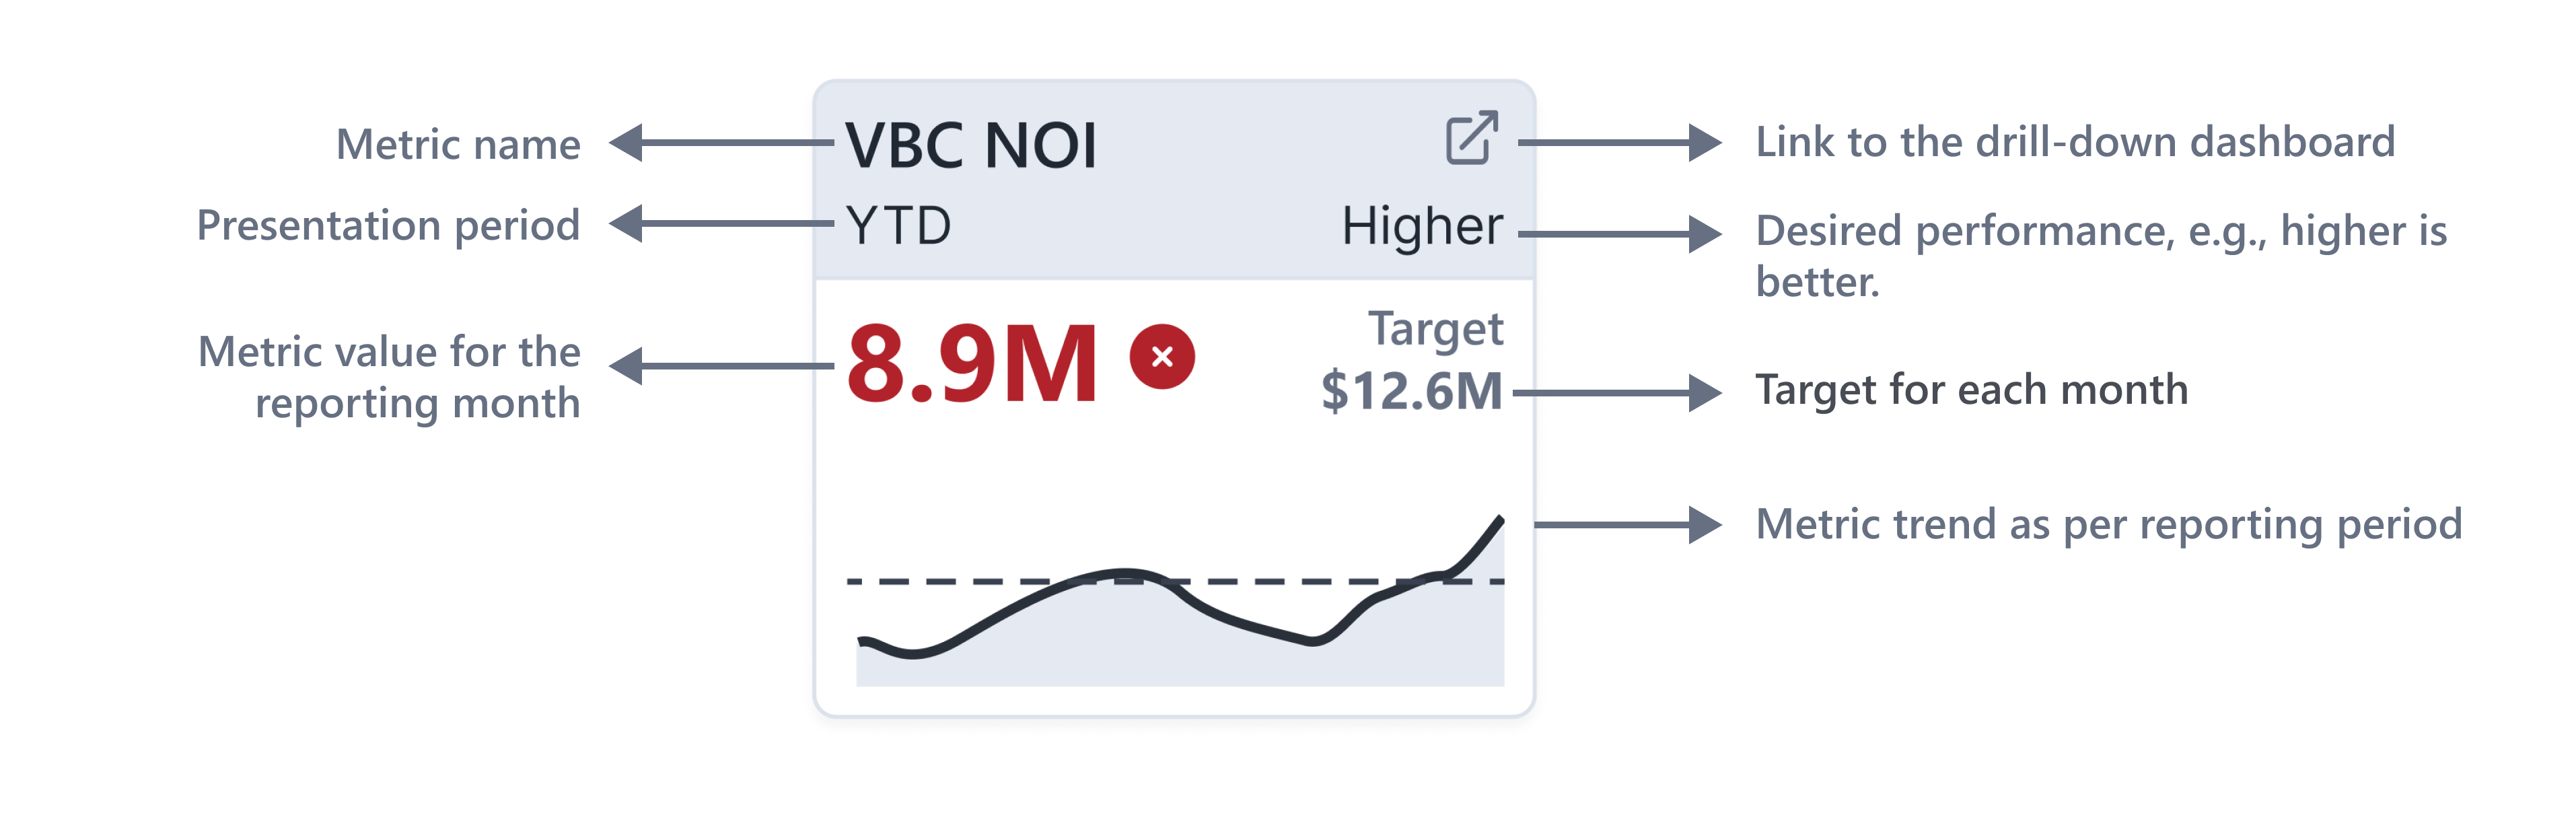
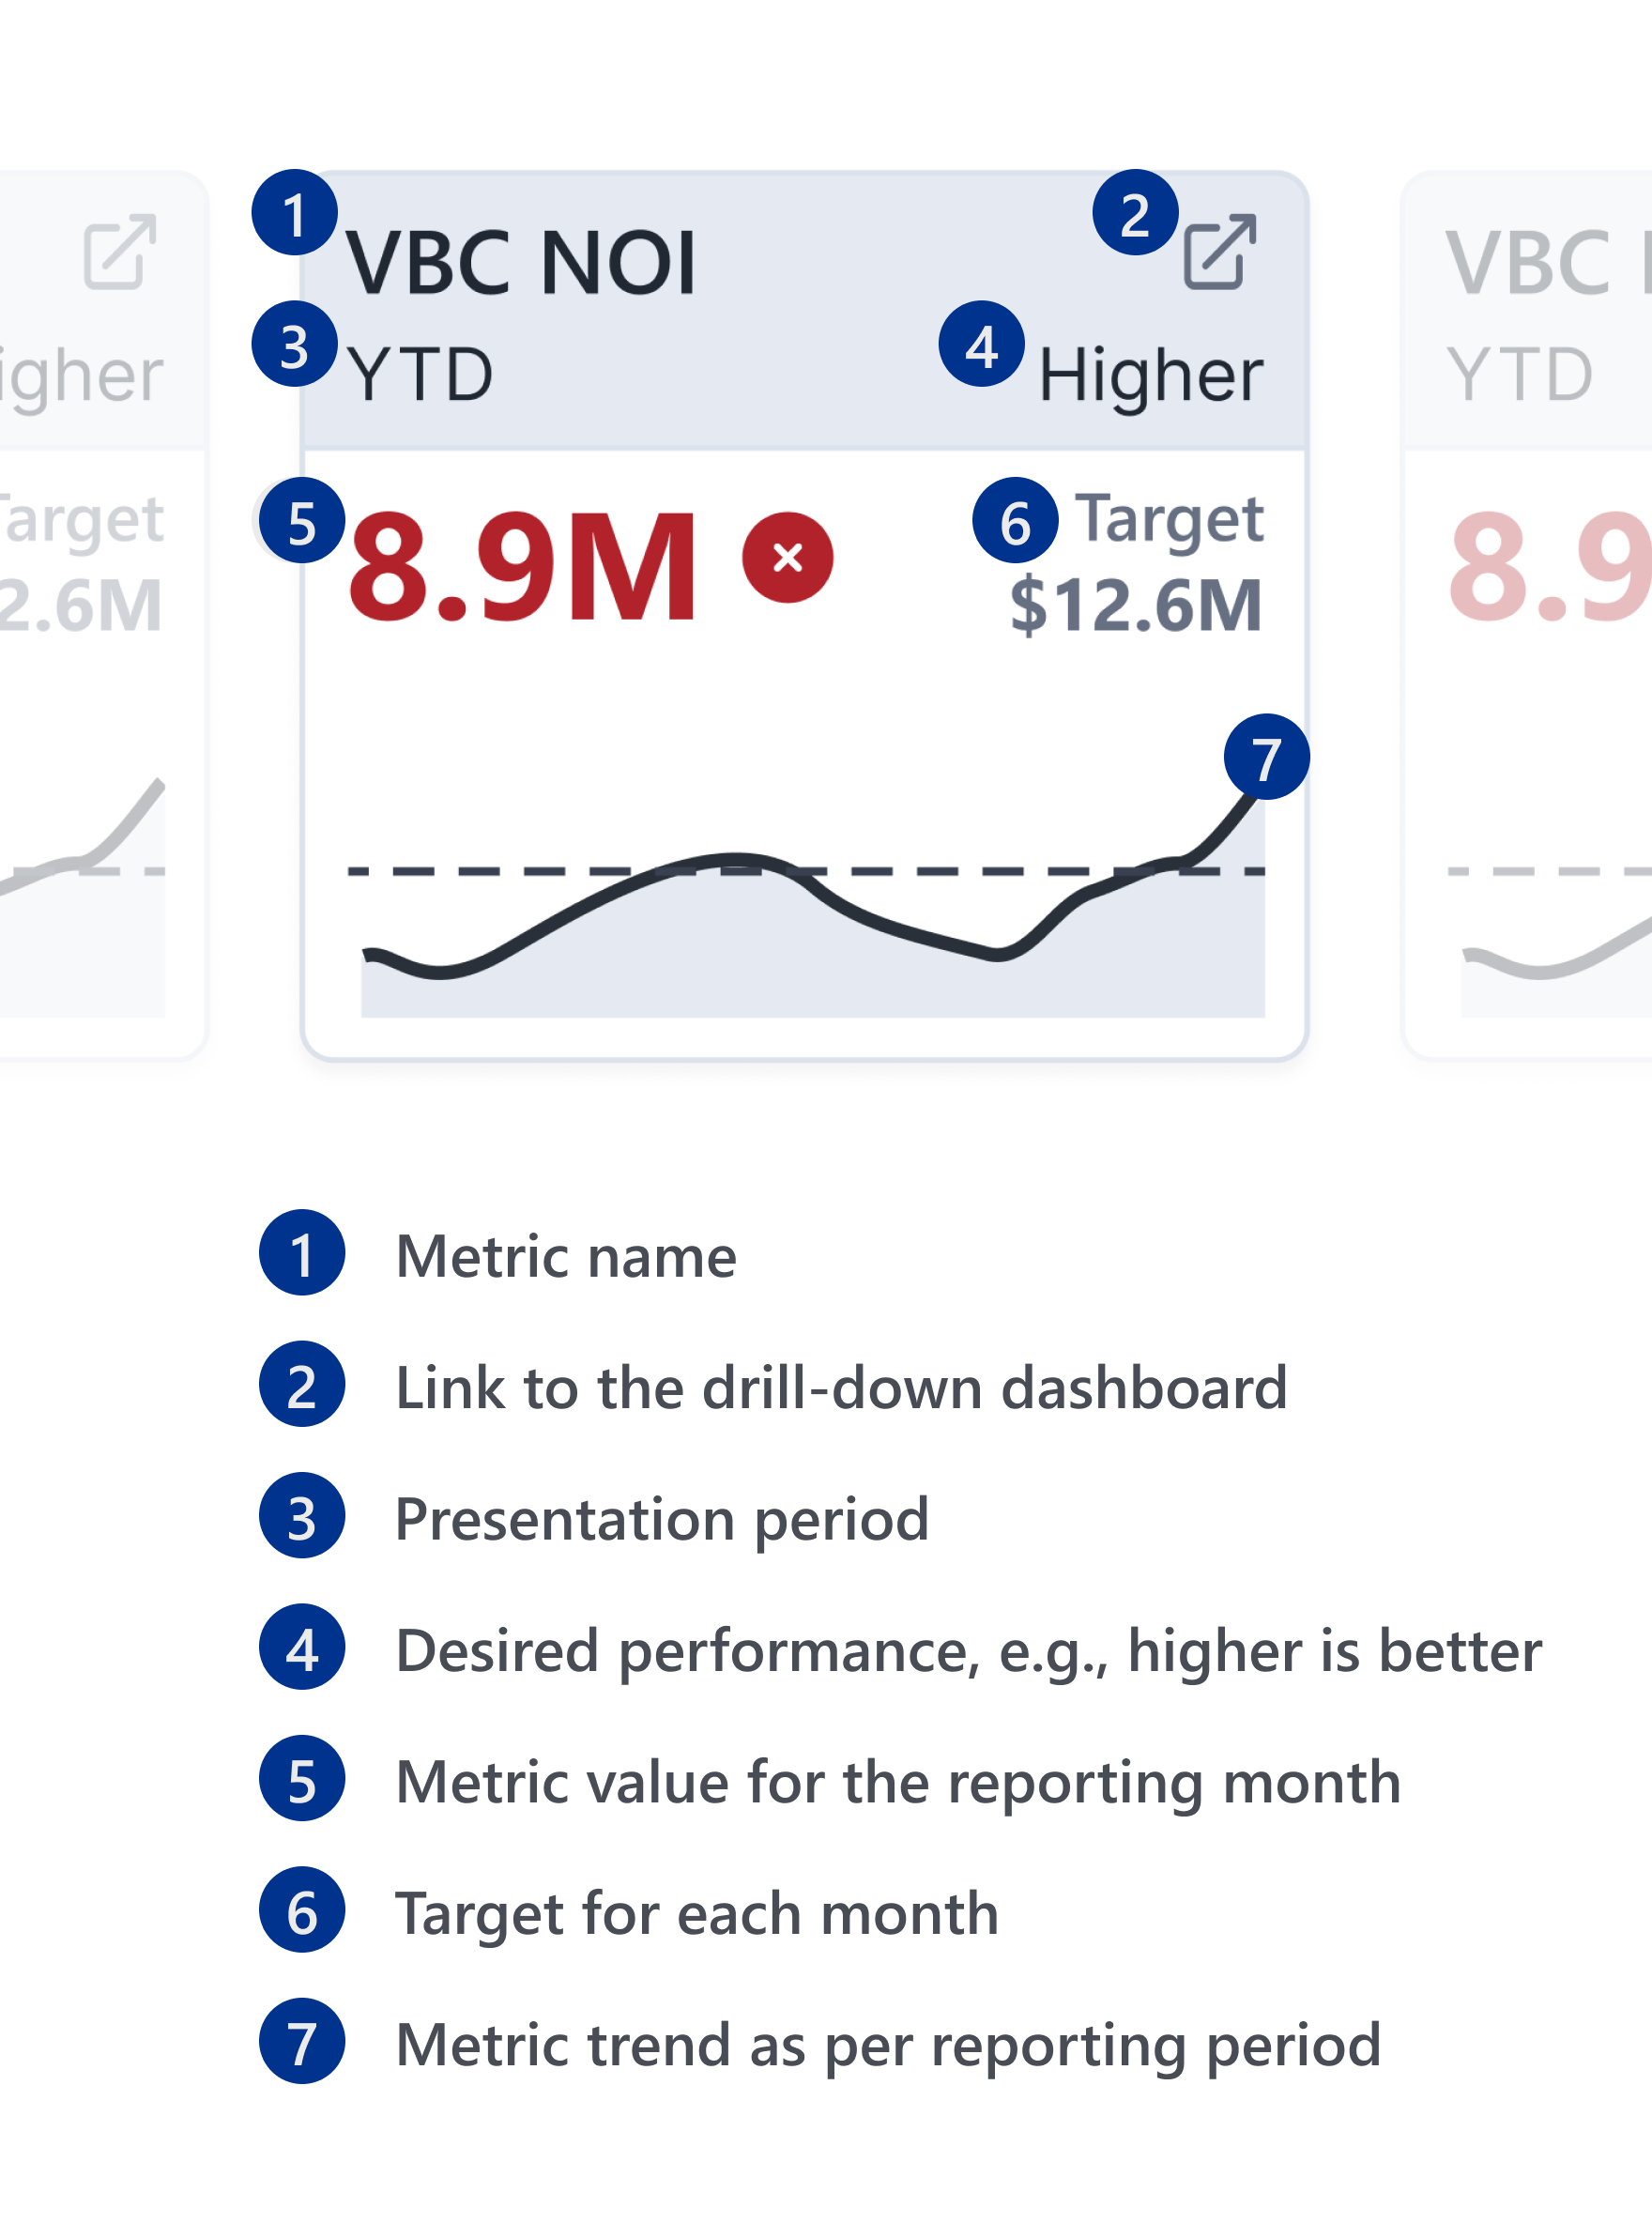
We also conducted rapid testing to determine what elements were most important for each metric. Based on user feedback, we organized the information in each KPI card in the following way:
This project challenged my assumptions about dashboard creation. Executives at Providence were interested in seeing all 31 metrics at the same time. I had to design a screen that fit all those metrics in a way that didn’t overwhelm users and also surfaced the most important pieces of information.
We went through multiple rounds of iteration and incorporated user feedback on each update.

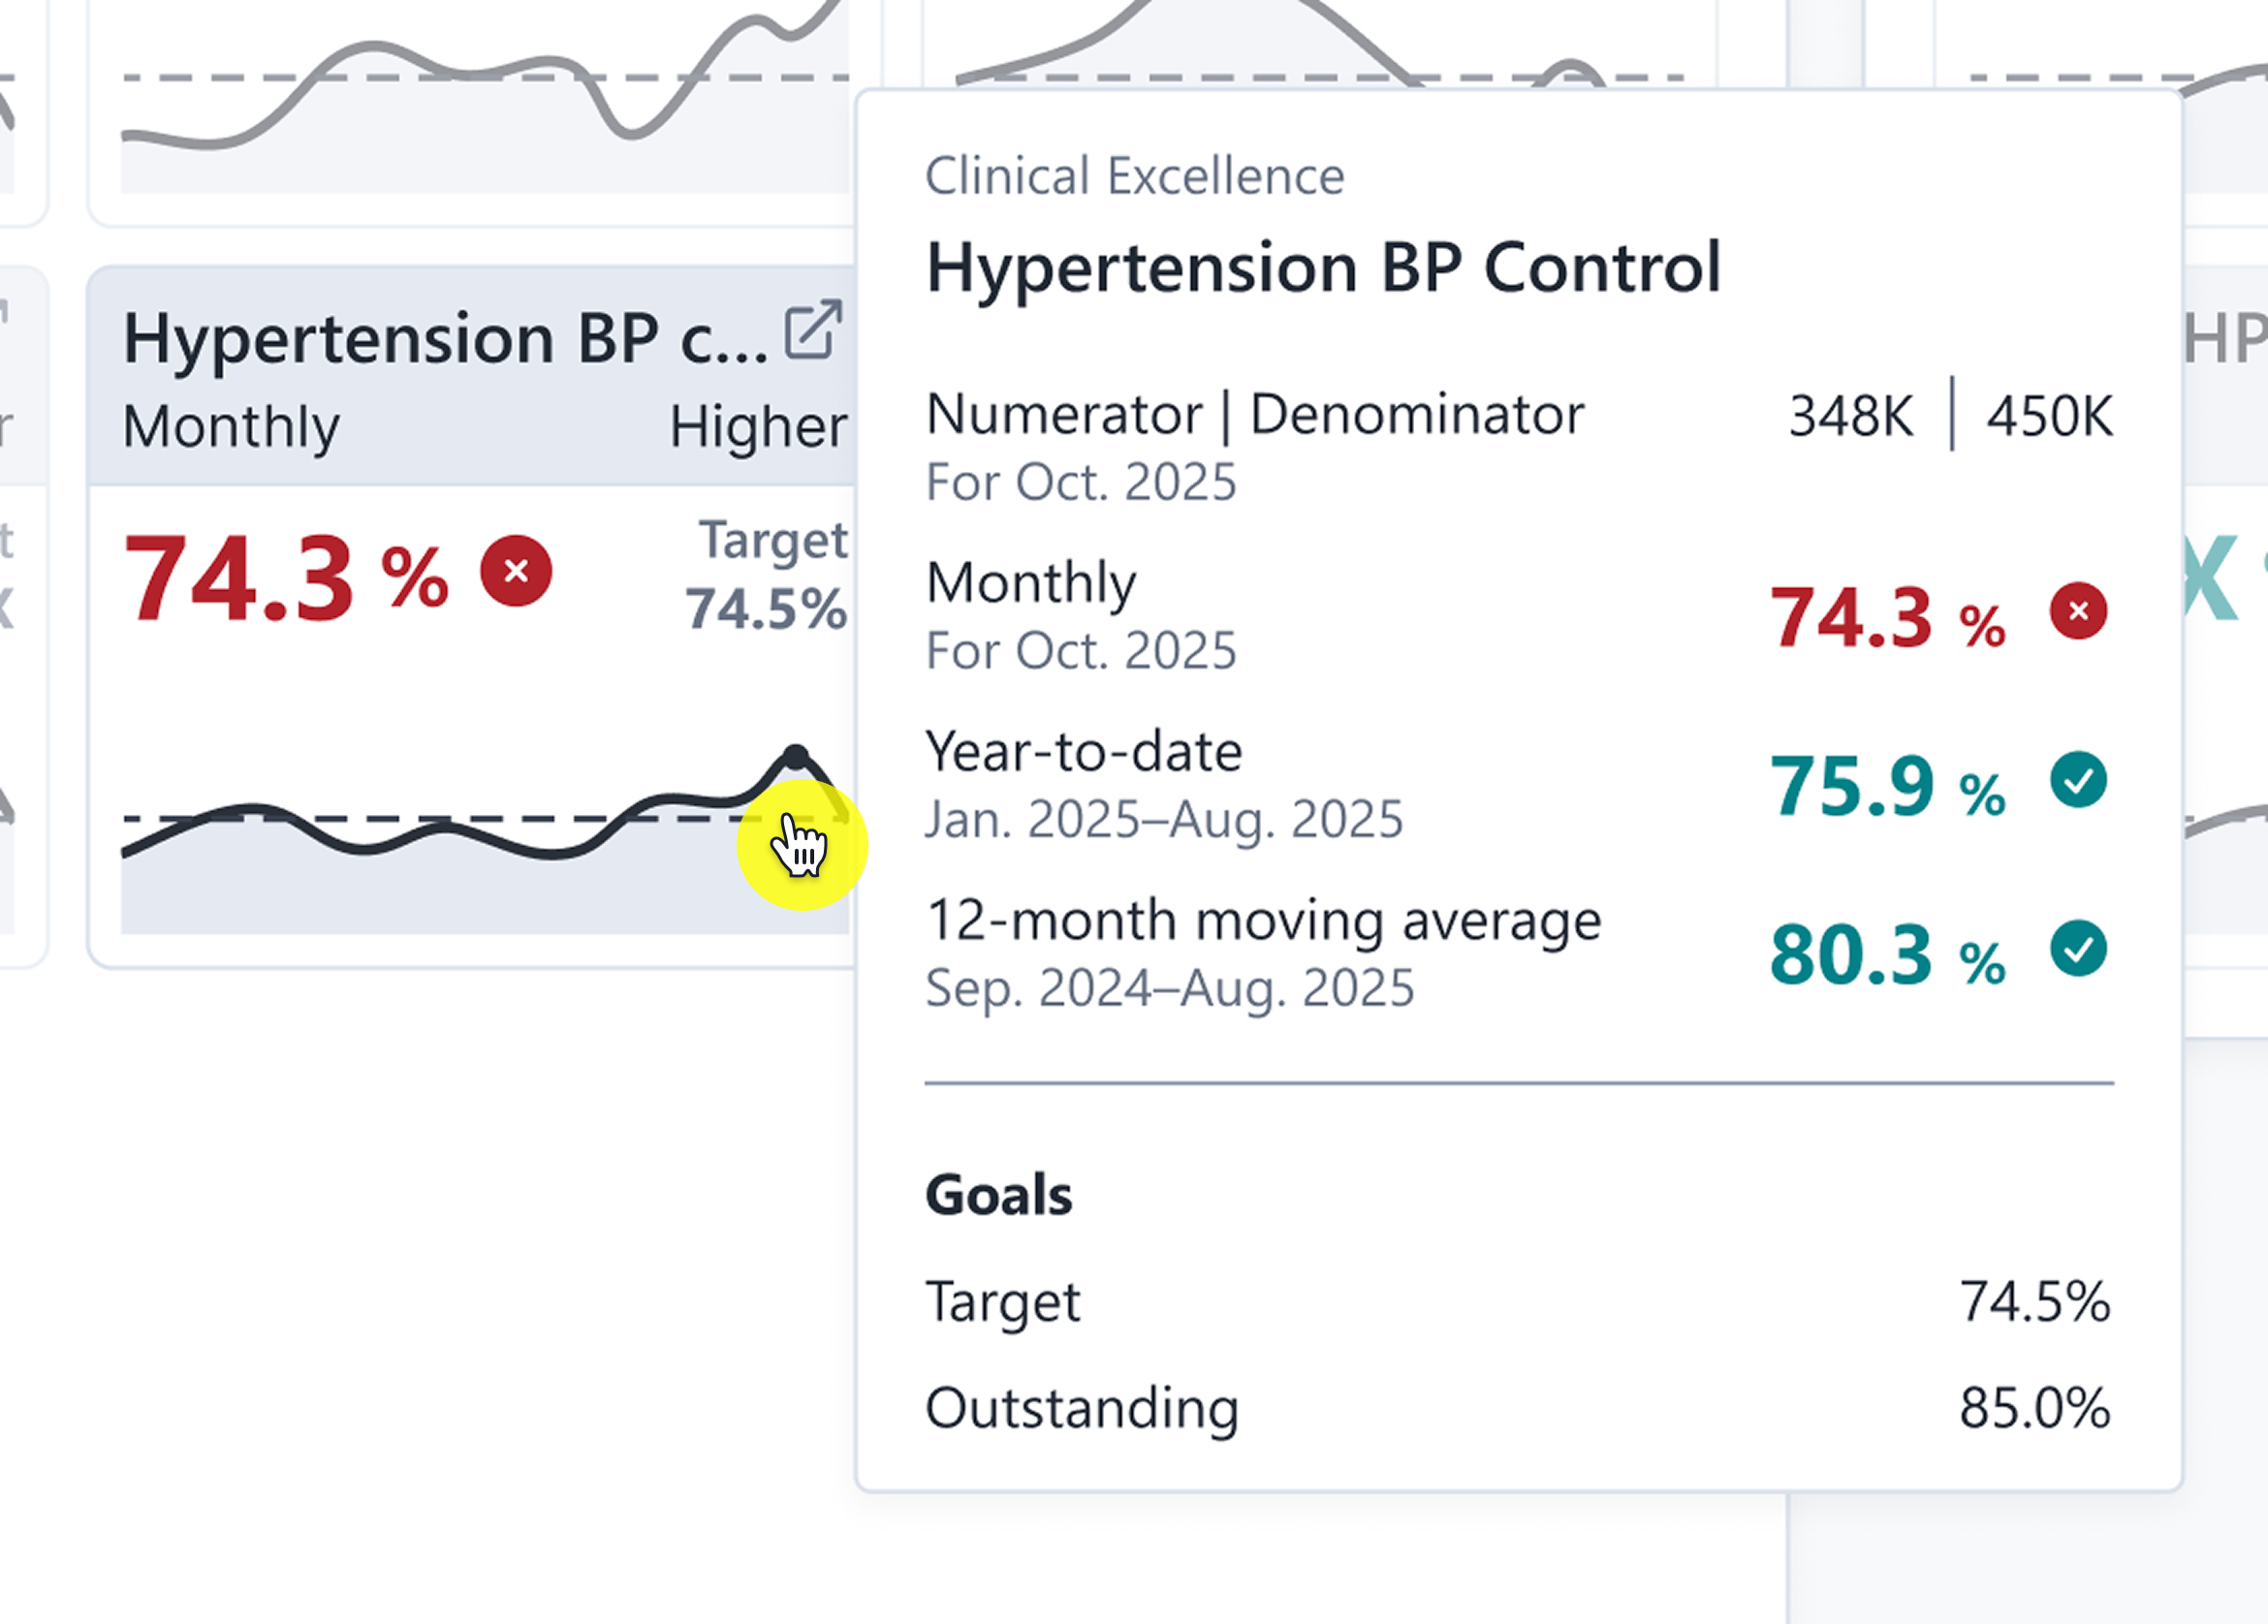
The users for this scorecard were also very interested in seeing all aspects of a metric. They wanted data on numerators, denominators, year-to-date values, 12-month rolling averages, and more. To accommodate a variety of reporting needs, we spent a lot of effort designing error screens and tooltips. You can see an example of a tooltip below.
After creating some rough mockups, we led a roadshow to get feedback from end users. I conducted seven one-on-one user interviews and demoed Figma mockups.
Our biggest takeaways were:
We took this feedback back to the drawing board and iterated on our designs. We introduced a Comparisons page and added more visual cues to highlight when metrics didn’t meet targets.
"It seems like it's quite intuitive. And so usability is one of the top things with any dashboard and any tool that's coming out. So kudos to you—I think it looks really fantastic."
Clinical Program Director
I piloted usability testing for the first time at Providence. I led 12 usability tests with end users. These were 30-minute one-one-one sessions where users thought out loud while completing pre-defined exercises.
From our tests, we learned that filtering on the Summary page was tricky. Many users didn’t know how to drill down from the system-level to the unit-level.
Besides this, most users said the scorecard was “intuitive.” I summarized the findings and presented them at a formal read-out.
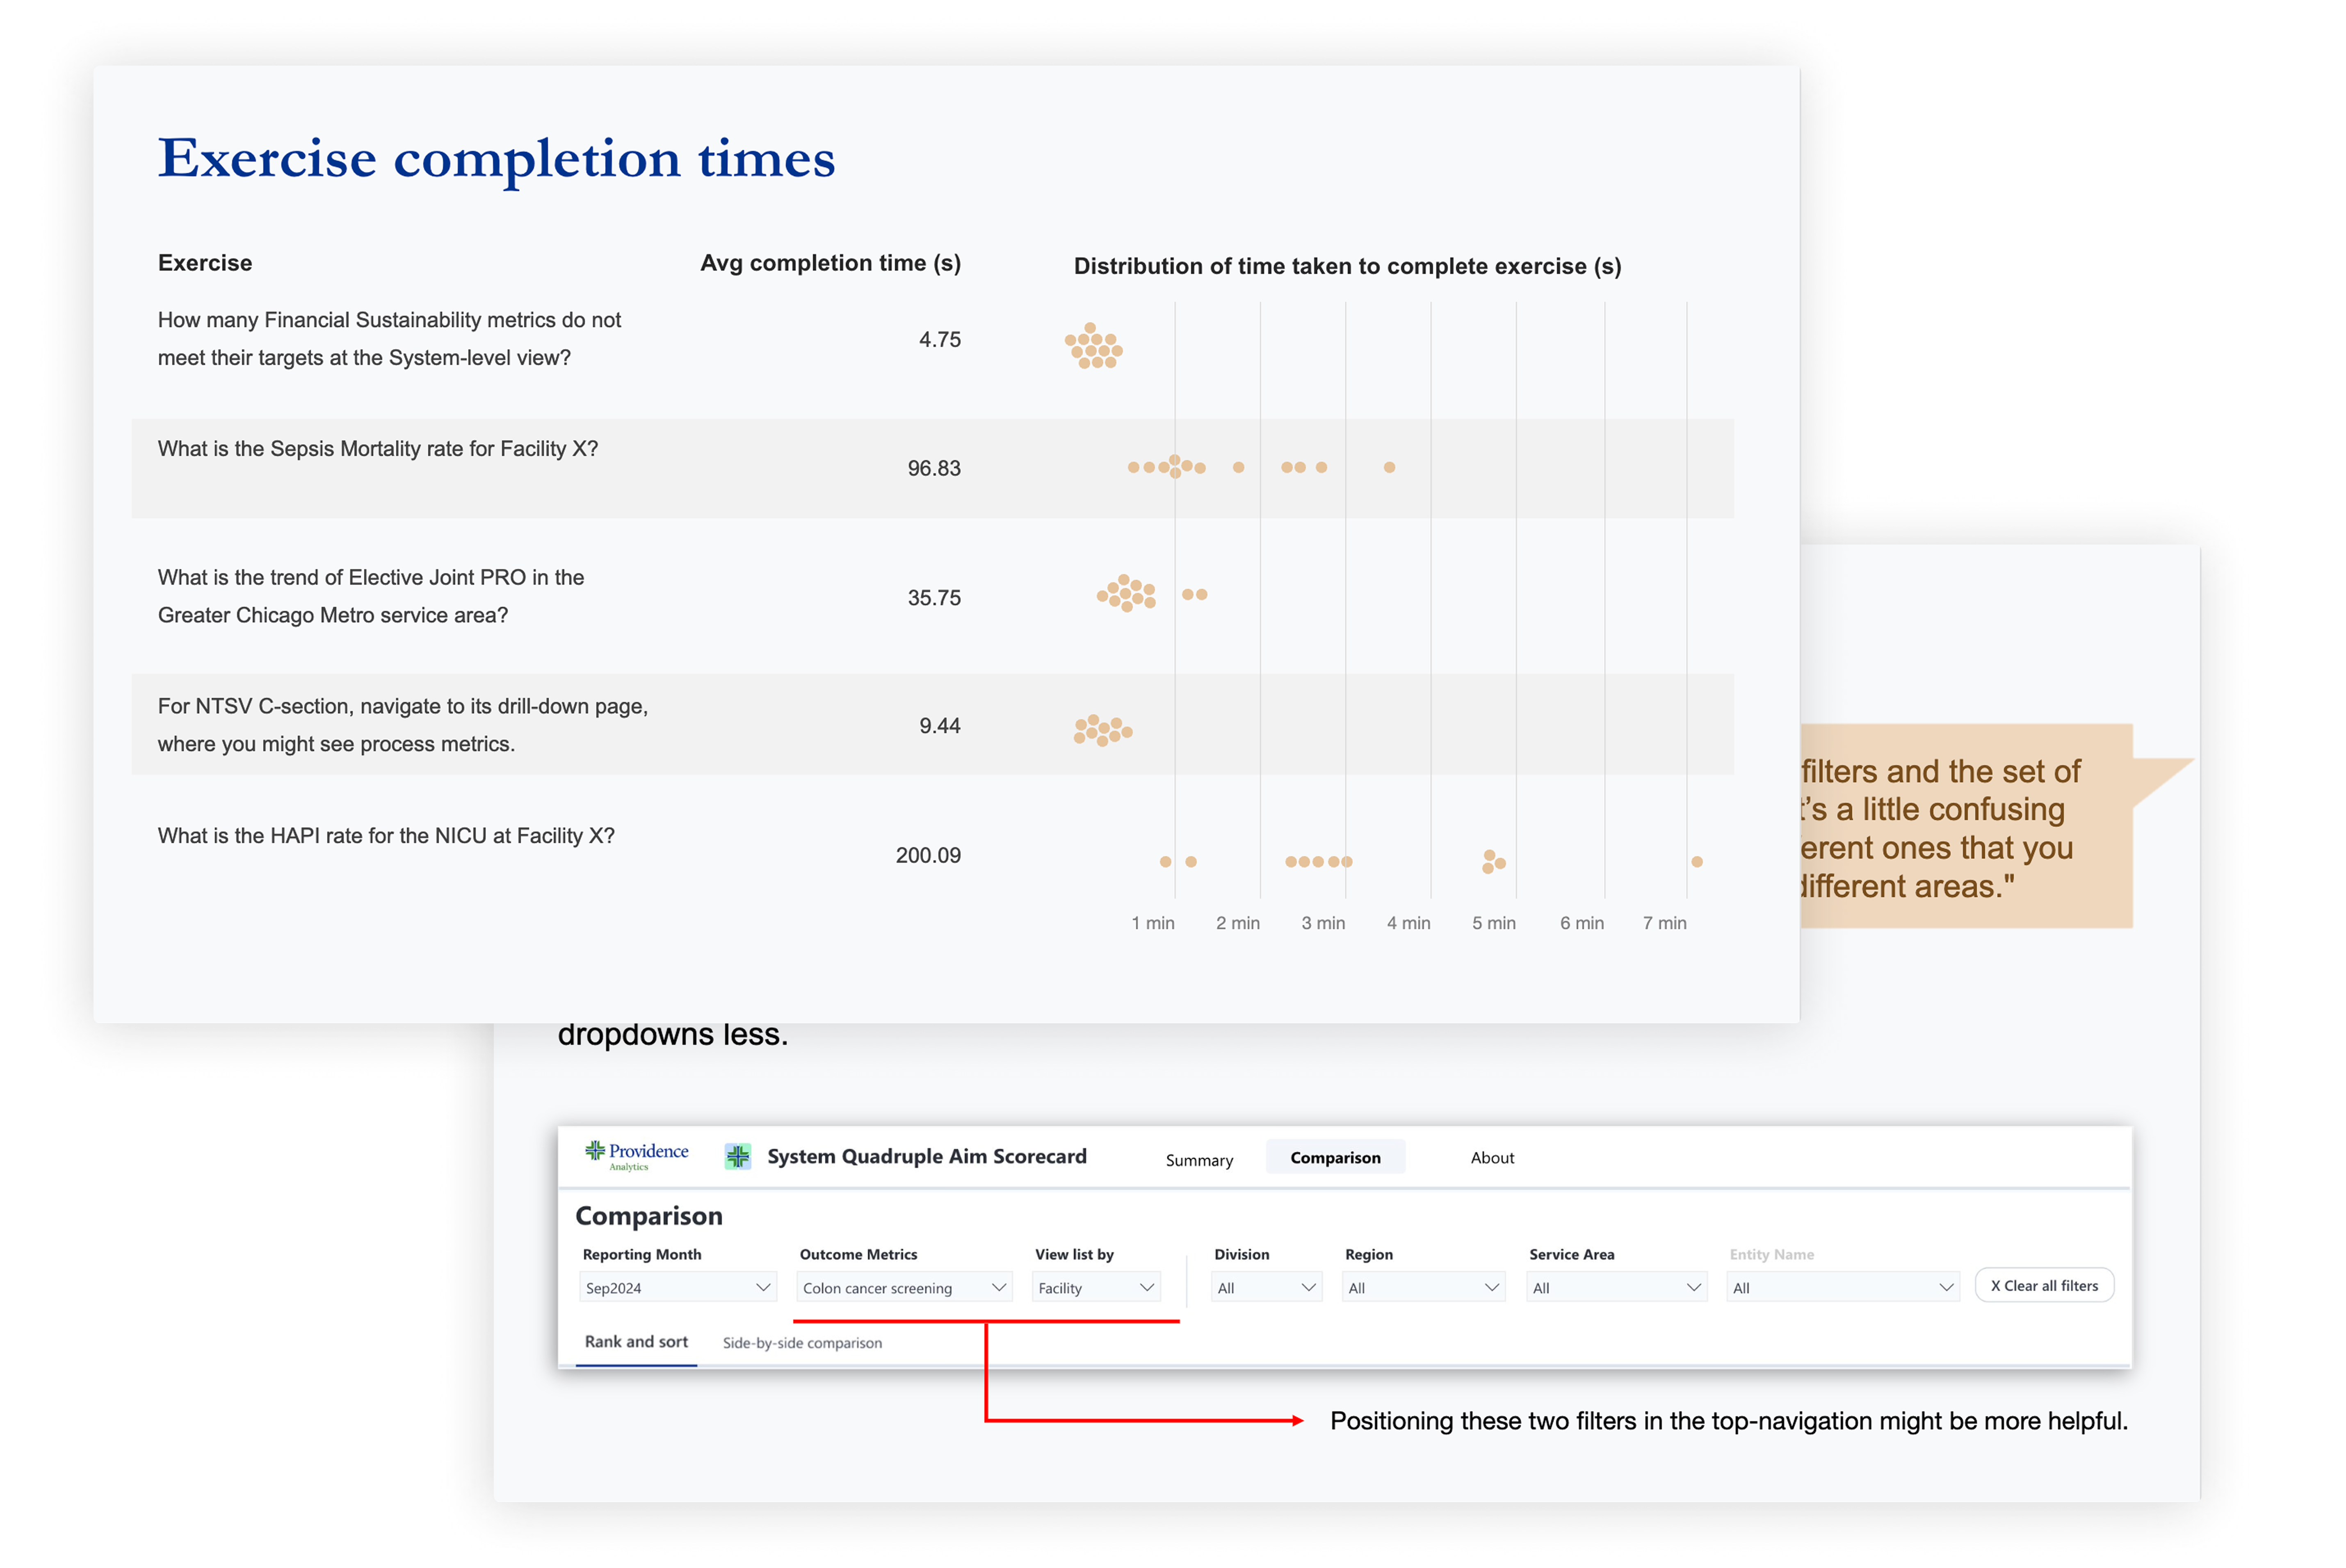
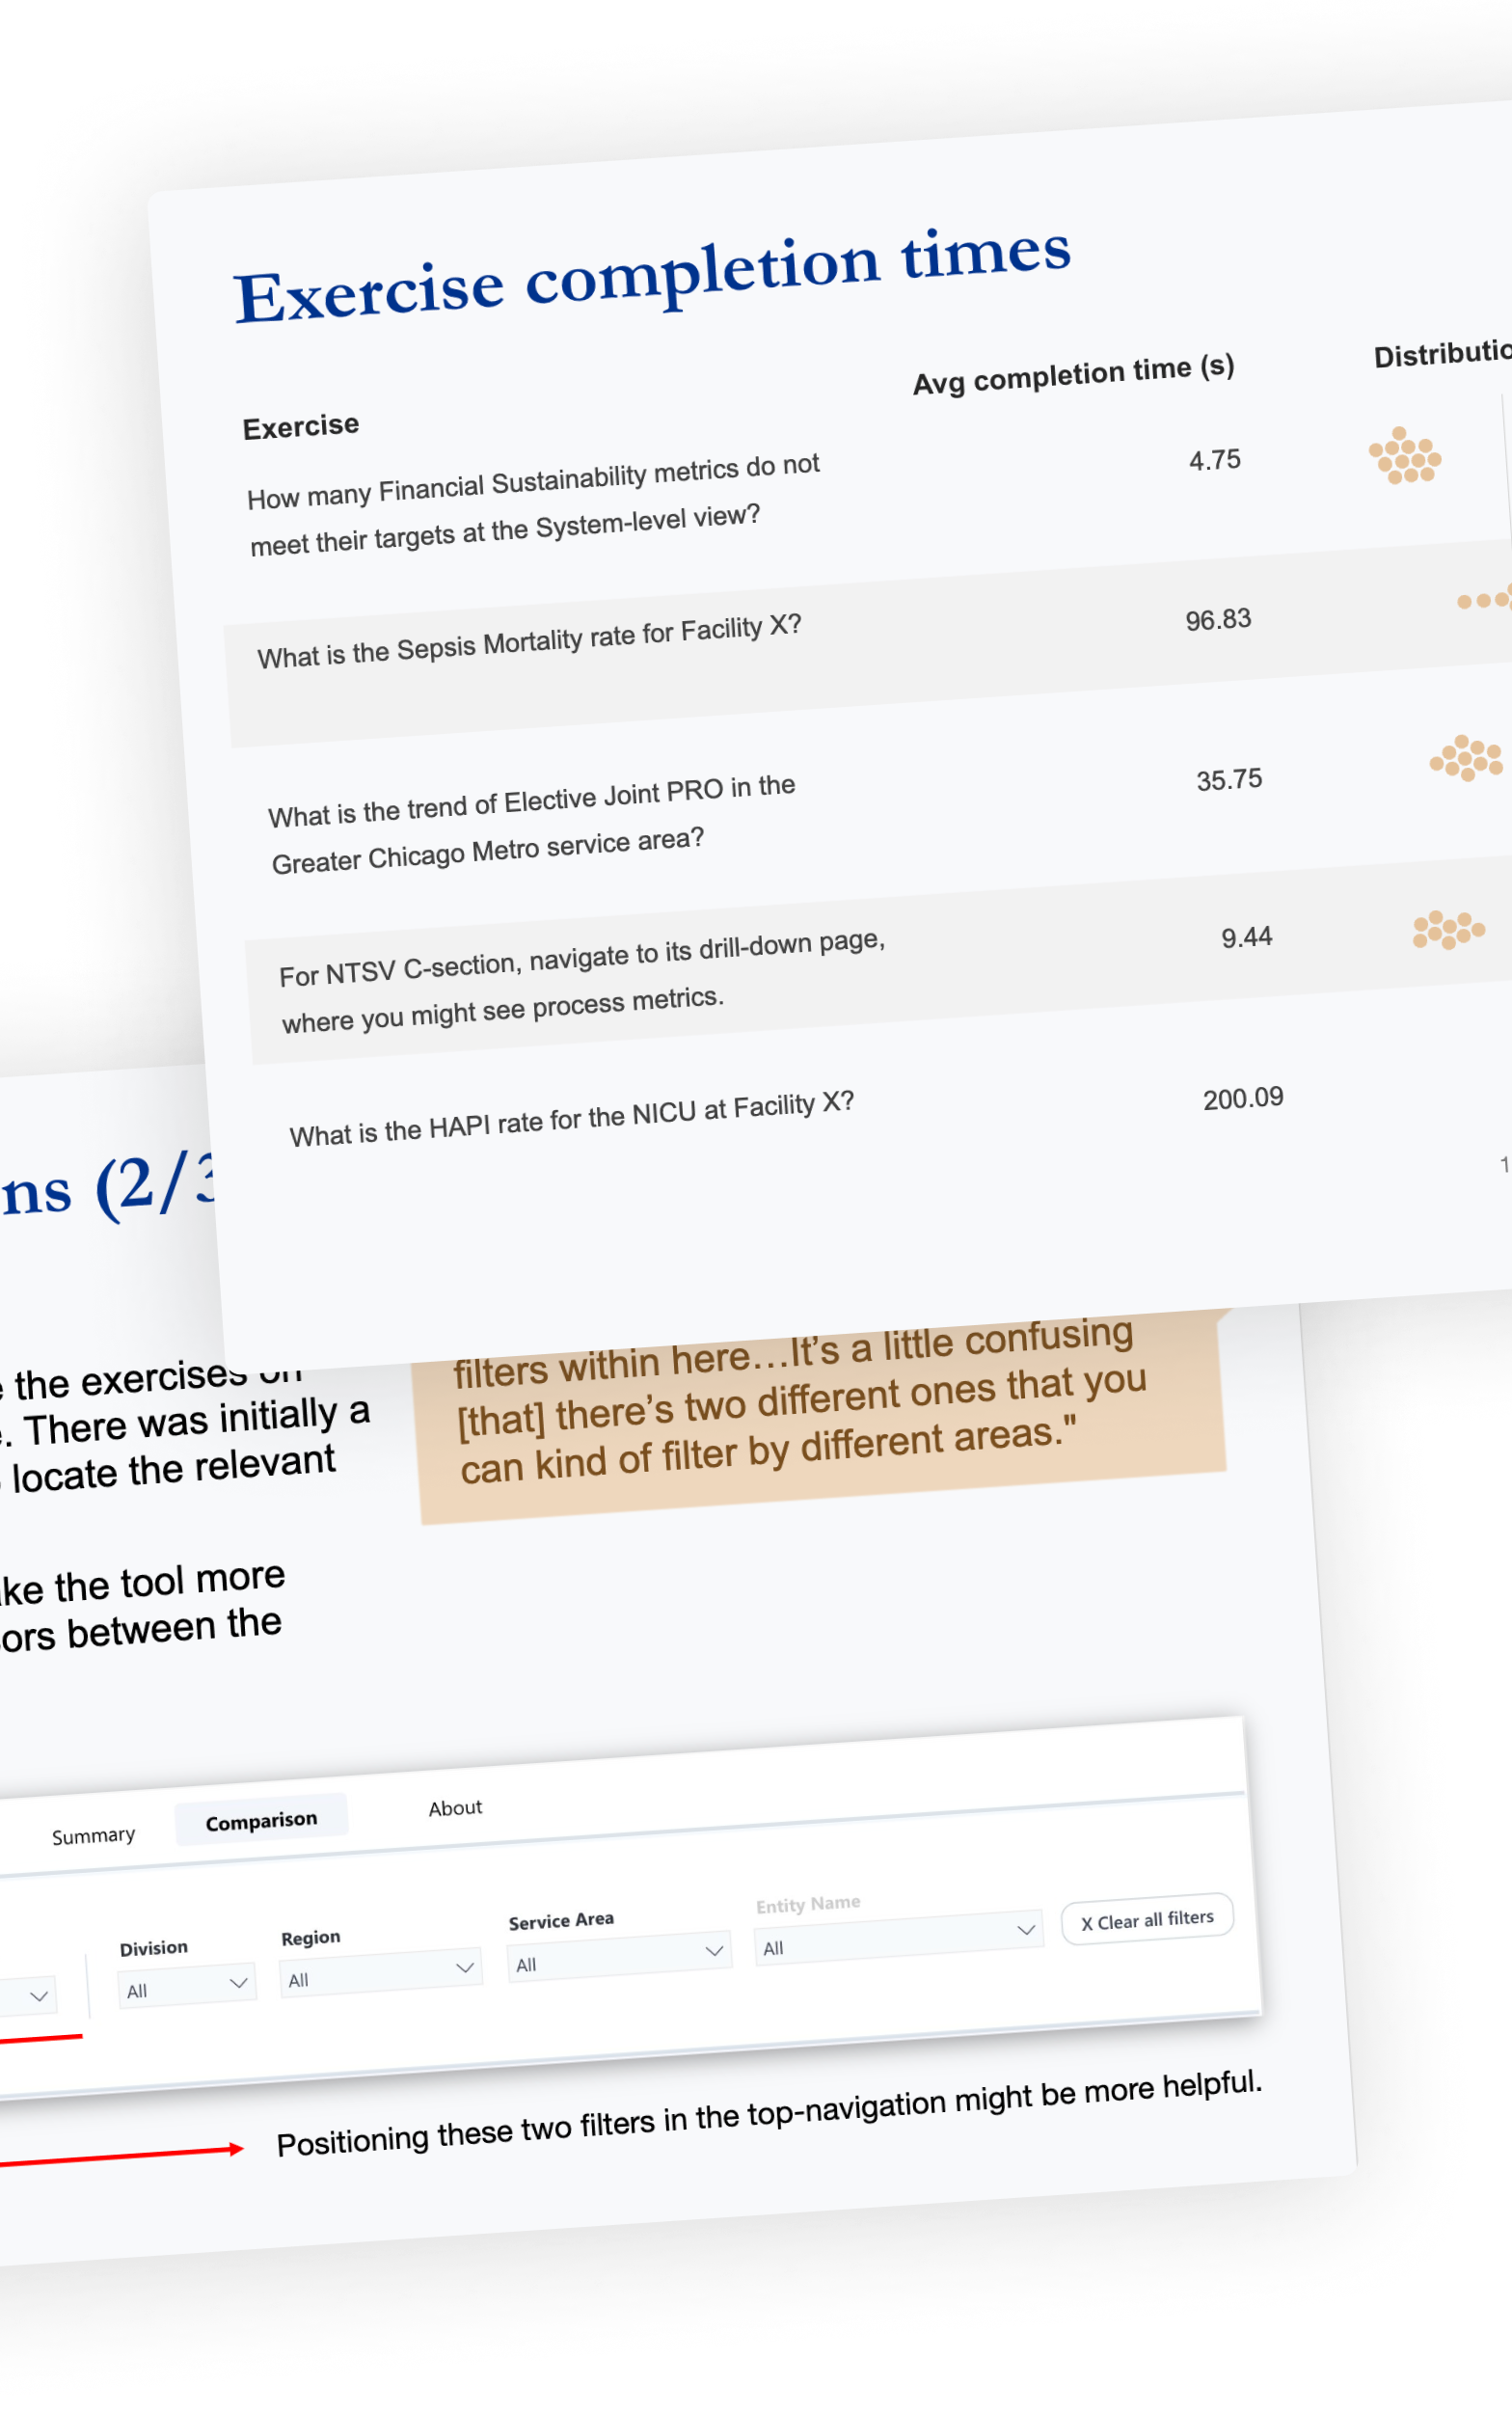
Two slides from the usability testing read-out deck. One slide shows the distribution of time taken to complete various exercises during testing.
In the months after this product launched, it created a wave throughout the organization. Board meetings and MORs across the organization required attendees to present using the scorecard.
In the five months since the scorecard launched, it was viewed over 13,000 times by 1,000 people across the organization. Unlike most dashboards which go through dashboard rot, this dashboard was viewed on a consistent cadence (see below).
The scorecard became a part of the organization’s vernacular: many executives approached the design team on other engagements asking us to build “Quad Aim but for [another domain]” and wanted it to “match the look-and-feel of the Quad Aim scorecard.”
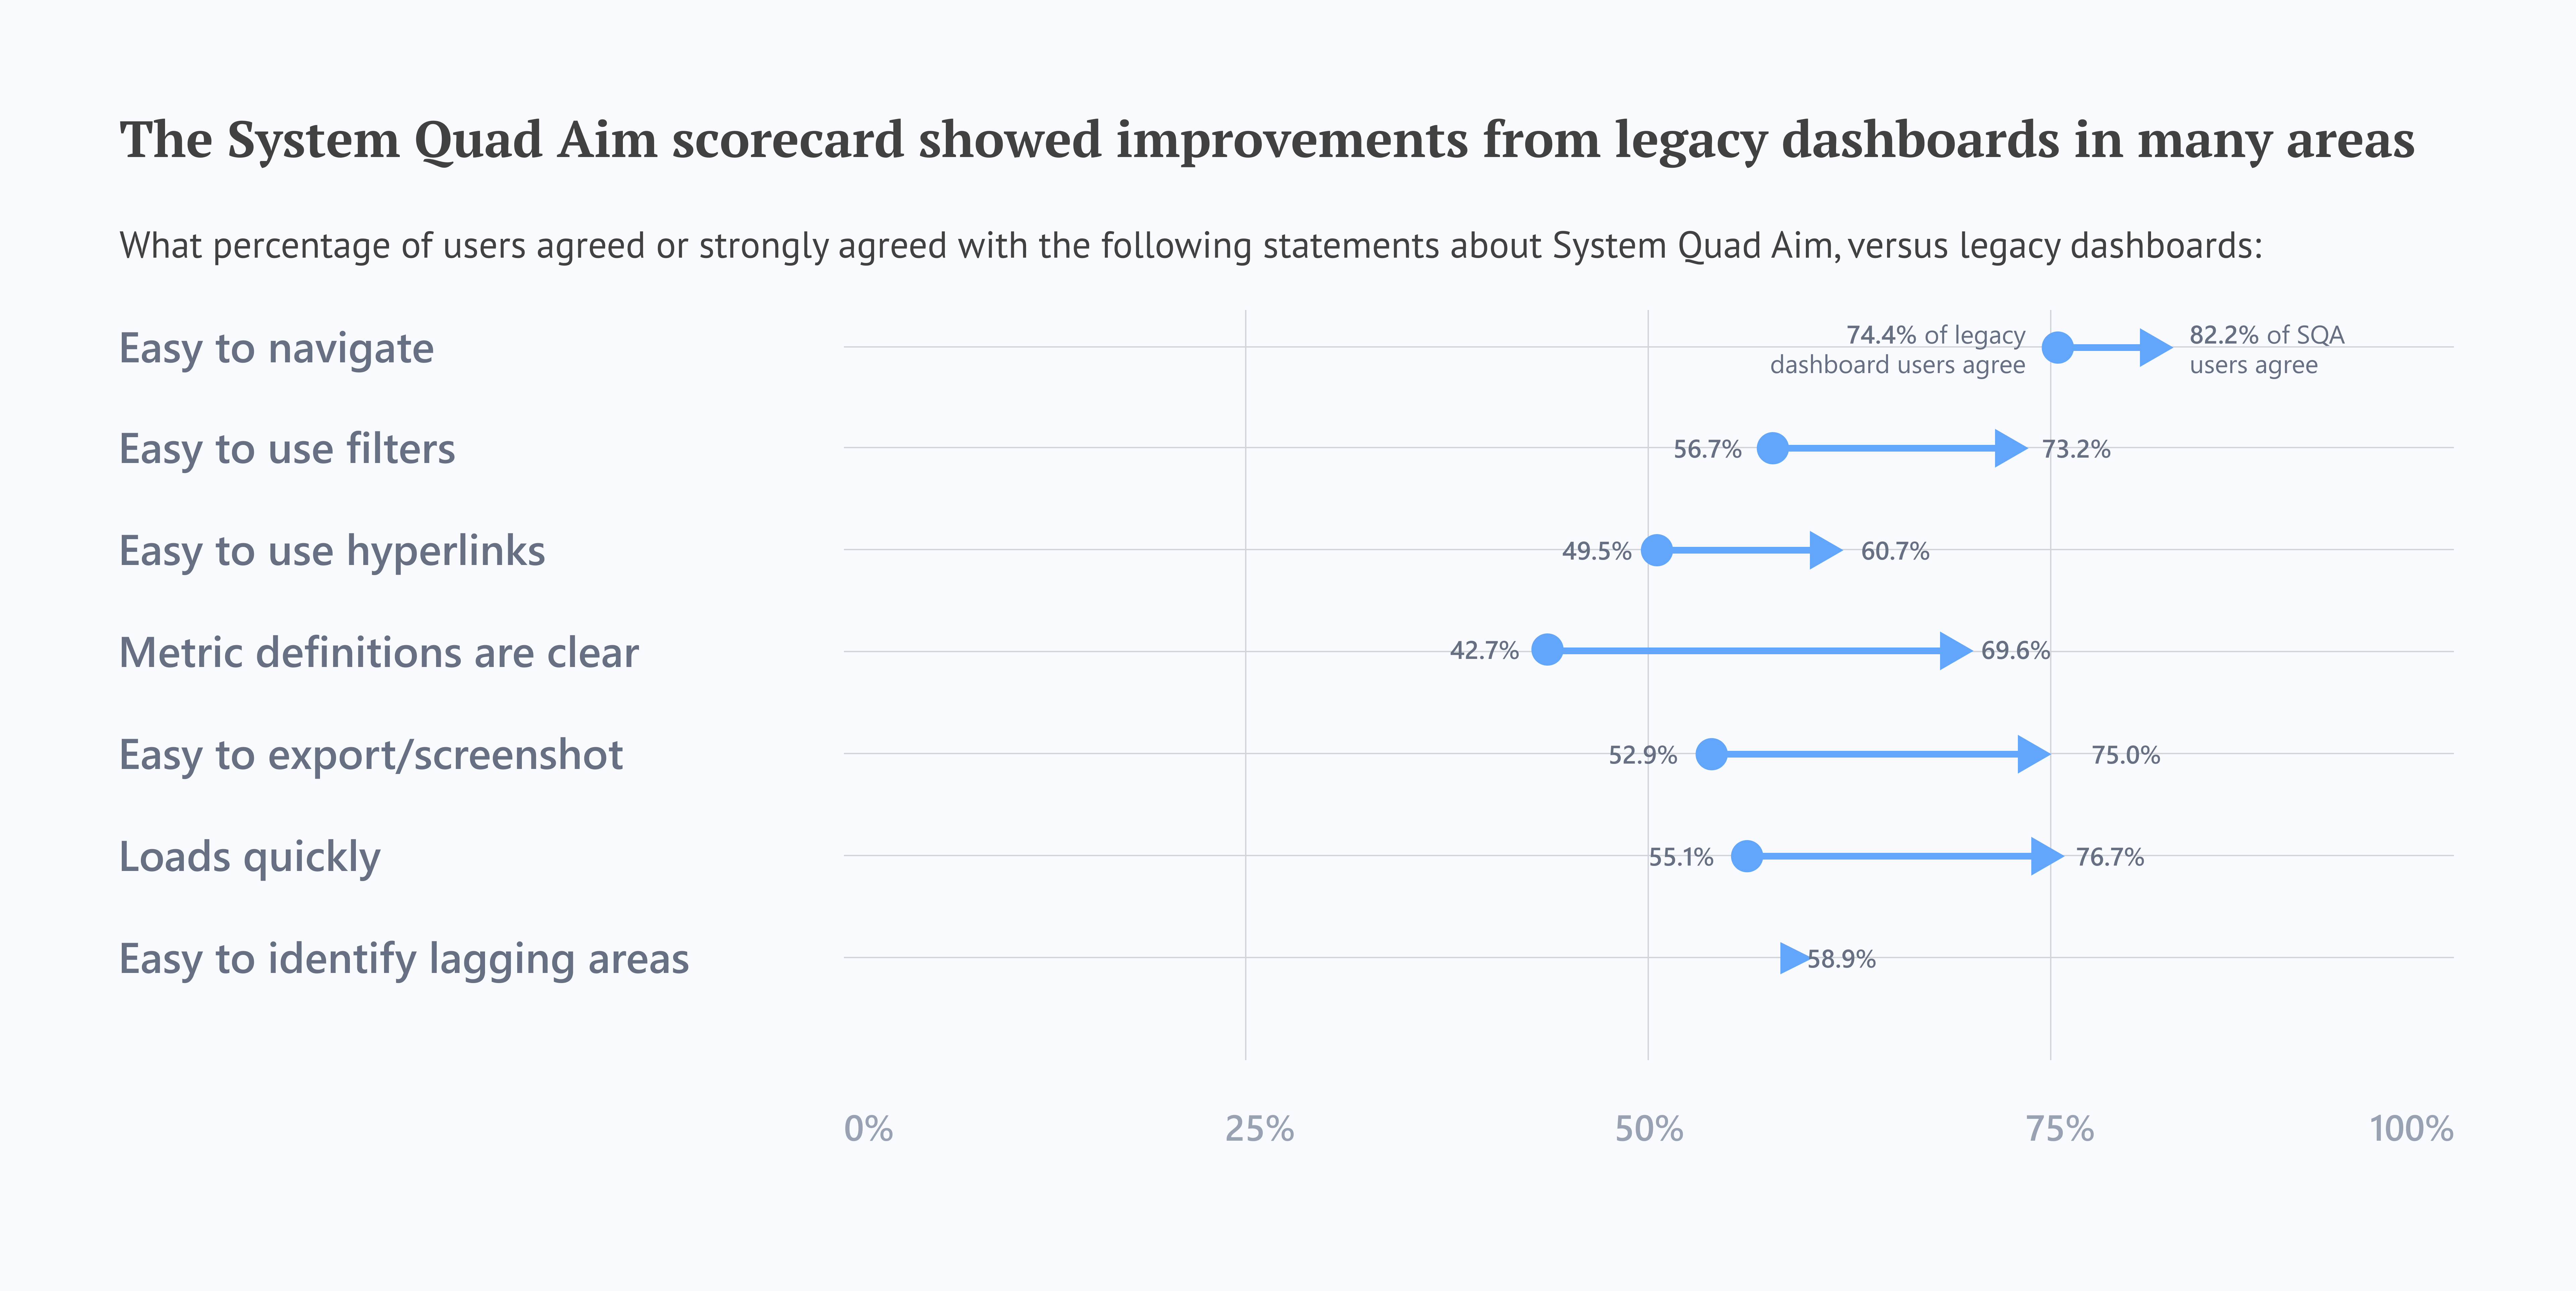
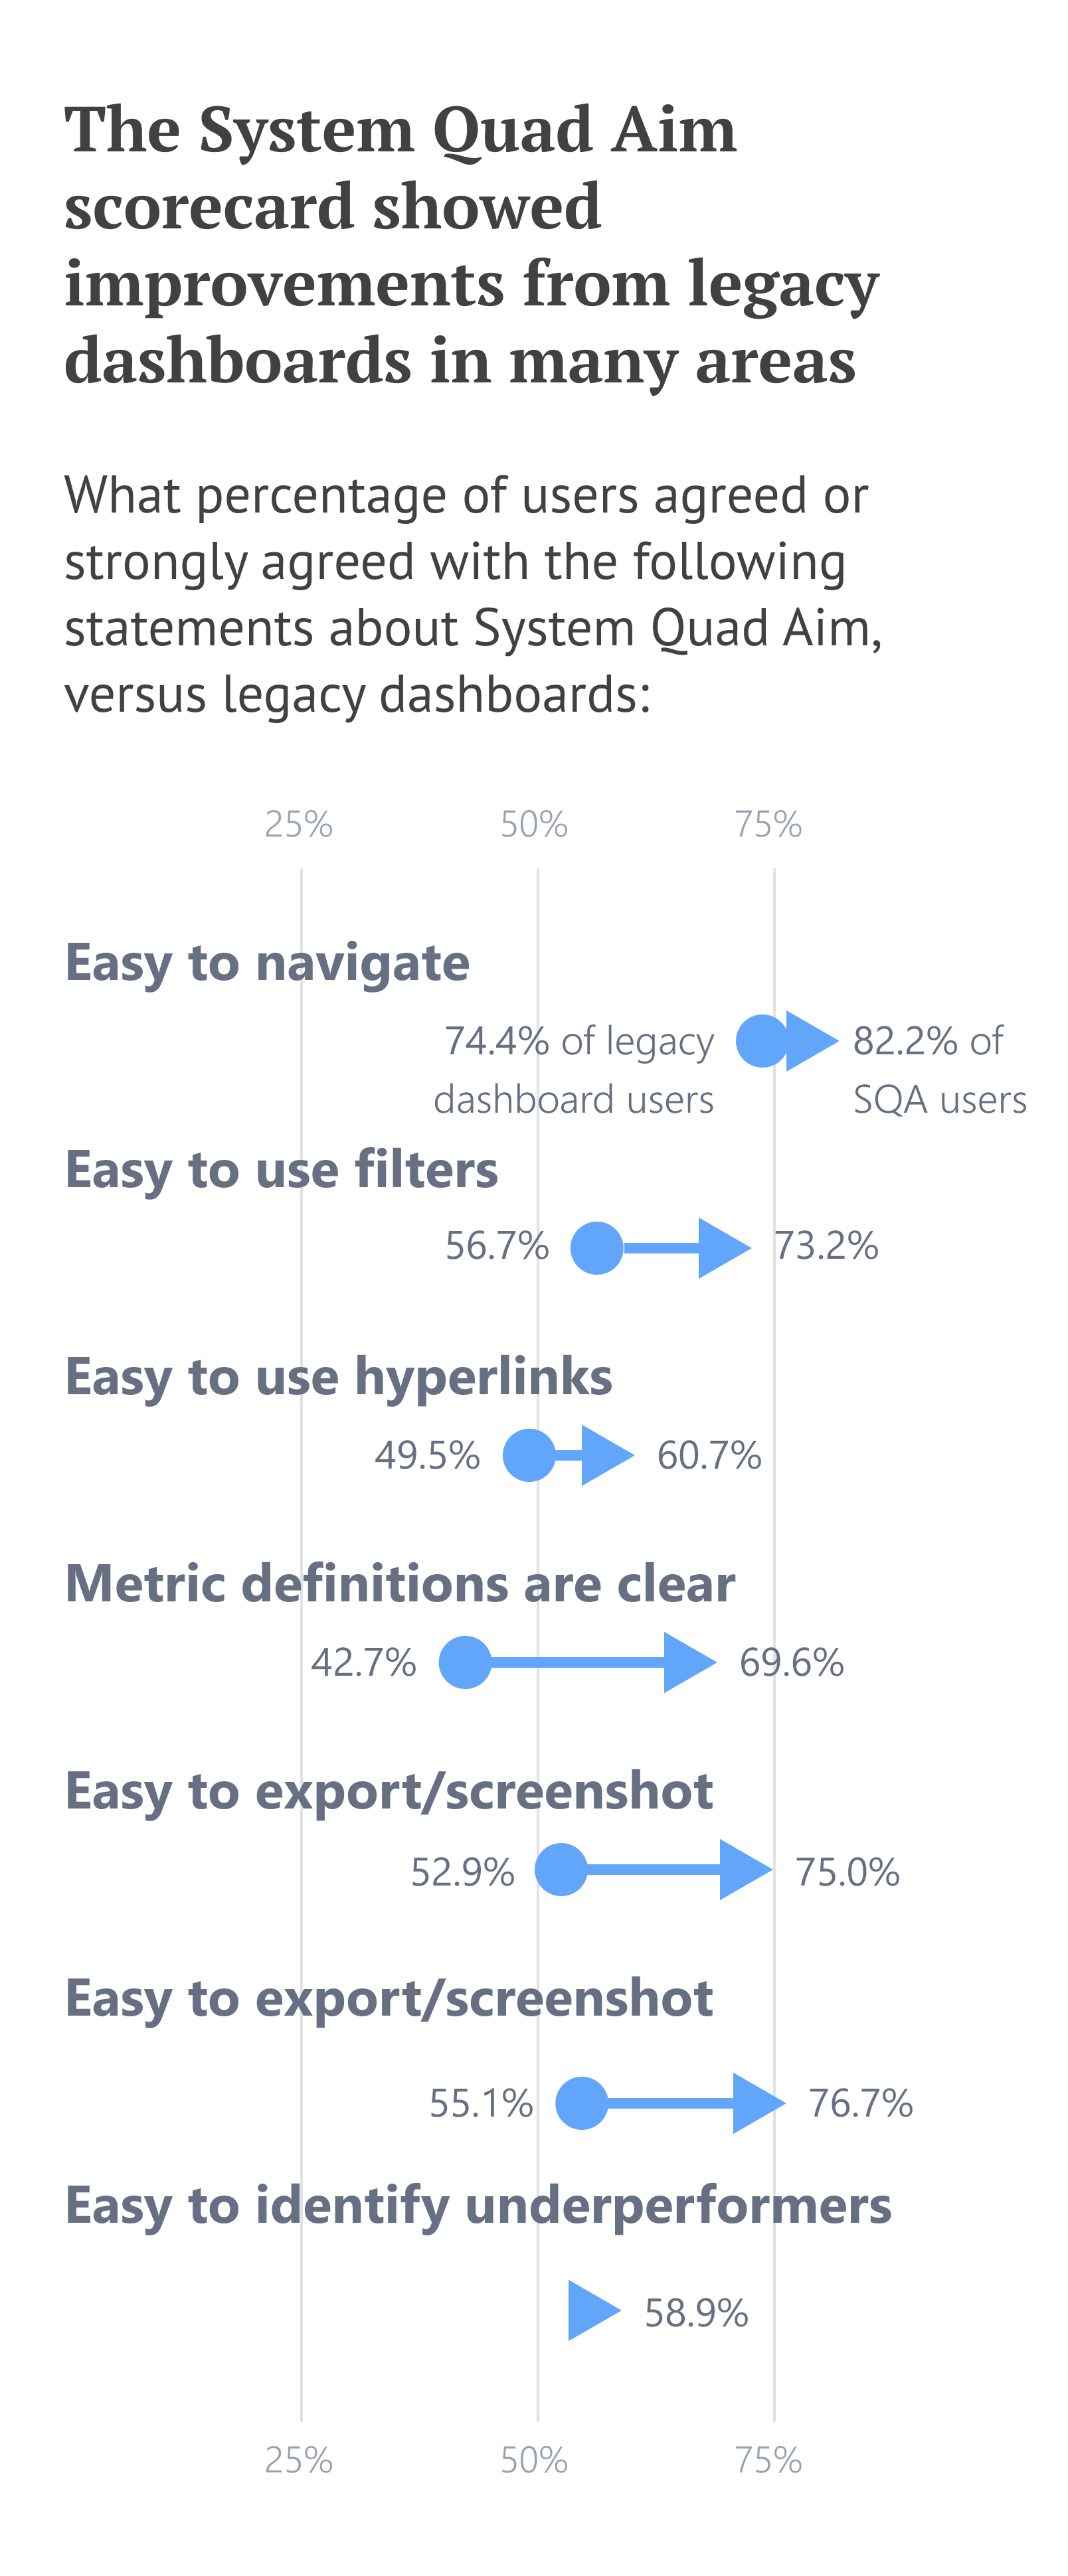
For the first time in the analytics department, we conducted a follow-up survey to assess how effective SQA was as an executive scorecard. The survey had nearly identical questions to the baseline survey to allow for easy comparison.
We learned that, in almost all areas, the SQA was a net positive from legacy dashboards, i.e., it was an improvement. The only places it lagged behind were on “understandable at-a-glance” and “overall satisfaction.” After digging through qualitative feedback, we learned that most users were confused by the tool’s refresh schedule. Metrics updated on different cadences and that didn’t interact well with users’ MOR schedules.
This will be addressed in following iterations of the scorecard.
I’m a data visualization designer with experience in UX design, data engineering, and analytics. If you liked this article, shoot me an email!